In this post, we will be going beyond the translation market that we belong to and will be looking at the language market. Working hard on the project in front of you is very important, but it’s sometimes helpful to take a step back to study the overall trends in the field you’re working in, the size of our field, and what the future prospects look like. Today, we will be looking at some statistical data about the language market to which we belong to get an overview of it.
A few years ago, ProZ uploaded a wonderful analysis report about the world language market, but no matter how much I tried to find it again, I couldn’t. It’s really such a shame… But as they say, if you can’t get a horse, ride a cow. So, I’ve found analysis data on the US language market, which we will be using to study the approximate North American language market.
The source of the data is http://www.economicmodeling.com/2012/03/21/industry-report-translation-and-interpretation-services/.
First, before looking at the overall language industry, this site picked and presented to us 5 industries that grew 40% or more after 2007.
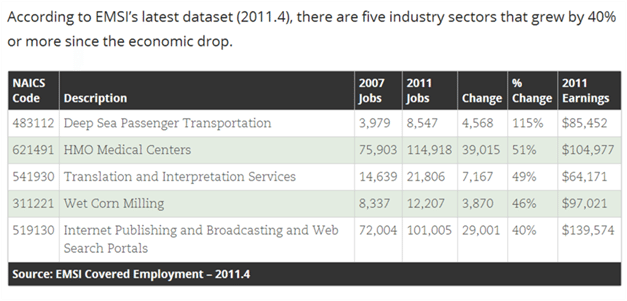
If you look at the above chart, you will see that the translation and interpretation industry came in 3rd place in growth rate out of all other industries, growing 49% from 2007 to 2011.
[bctt tweet=”The translation and interpretation industry came in 3rd place in growth rate out of all other industries.” username=””]
Also, the average wage for 2011 is said to be $64,171. (It’s a little ambiguous to see this number as being the average income of translators in the United States. I will analyze it a little more deeply below.)
Now, let’s study the language industry in a little more detail.
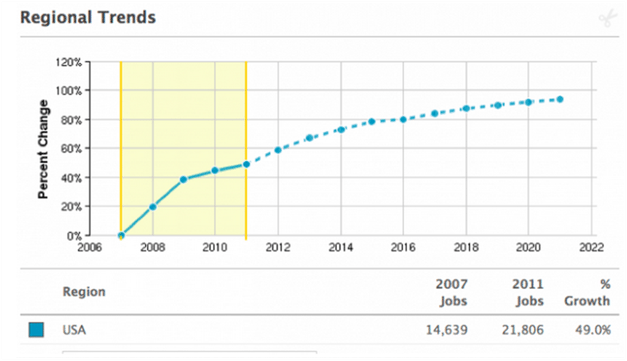
If you look at the above graph, you can see the steep growth rate of this industry. It’s 2014 right now and the graph estimates that this industry would have grown 70% from what it was like in 2007. I can’t confirm that this prediction was true, but I think it probably did grow that much. This kind of growth is actually tremendous. It is even more astonishing if we consider the fact that the U.S. was experiencing an economic recession at that time and is just starting to recover now.
There is another piece of data you should take a look at:
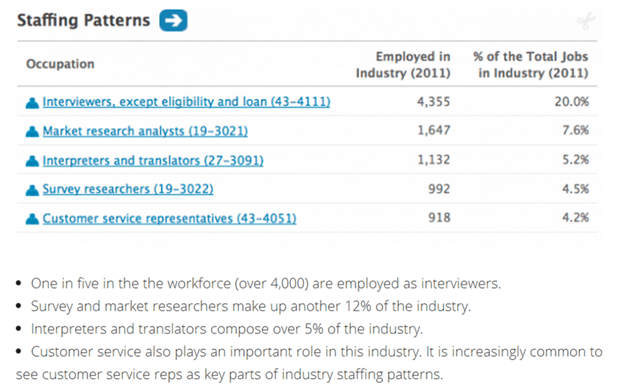
From the above data, we can see that translators and interpreters make up only around 5% of the industry. You might find this a little strange, but this is because these types of statistics are very strict in their investigations, following technical qualifications. For example, 54% of my clients are located in the U.S., but I am not an employee of any of those agencies. (I explained the concept of “employ” and “hire” in another post.) So, I think that the 5% listed in this statistic is referring to so-called in-house translators and interpreters. For example, government agencies, hospitals, etc. in many states of the U.S. have a high enough demand for translation and interpretation to hire Spanish translators and interpreters as employees. From that information, you can see that the number said to be the average income of the industry, in fact, can’t be seen as the average income of translators. A translator is an individual business, so his/her income is discovered through individual tax reports, not through this kind of industry analysis report. All things considered, through this data, you can still get a pretty good objective view of how much demand there is for the language industry (translation, interpretation, etc.) in the U.S., how many new agencies are developing, etc.
To add one final thing, these are the statistics divided by state:
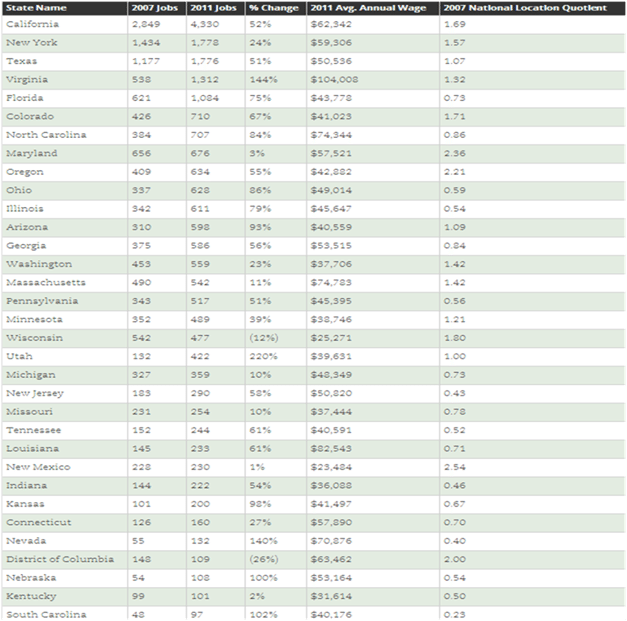
From this, you can see that California is overwhelmingly ahead. There is no analysis of the reason for that, but I think it’s because they have lots of immigrants and it’s close to the Pacific Ocean, giving it a higher chance, time zone-wise, of connecting with the Asian market. However, in terms of average income and rate of growth, you can see that the smaller state of Virginia actually has better conditions. This is probably another interesting situation created by supply and demand in the market.